Showing posts with label Apporach. Show all posts

Sunday, 17 January 2016

Answers:Need suggestions - Informatica mapping to find department-wise top two salary without using rank transformation.


Hello readers,

Need your answers on this scenario.this question is asked  in Accenture technical interview .

Monday, 1 June 2015

Business Intelligence (BI)


What is Business Intelligence (BI)?

  •  Business Intelligence is a generalized term applied to a broad category of applications and technologies for gathering, storing, analyzing and providing access to data to help enterprise users make better business decisions
  • Business Intelligence applications include the activities of decision support systems, query and reporting, online analytical processing (OLAP), statistical analysis, forecasting, and data mining
  • An alternative way of describing BI is: the technology required to turn raw data into information to support decision-making within corporations and business processes


BusinessIntelligence Architecture overview
BusinessIntelligence Architecture


Business intelligence has become a critical element of information technology. It’s an old term with general or even ambiguous meaning. It has been used synonymously with decision support, analysis, and data warehousing, but today business intelligence has a more specific definition and a better understood application. Taken literally, business intelligence is just that—intelligence or understanding of your business. You get that understanding by analyzing your business operations.


This business intelligence process can deliver significant, bottom-line results. Implementing its technologies and applying its process can help make your business more effective and more efficient, increasing revenue, decreasing costs, and improving your relationships with customers and suppliers.

   Why BI?
  • BI technologies help bring decision-makers the data in a form they can quickly digest and apply to their decision making.
  • BI turns data into information for managers and executives and in general, people making decisions in a company.
  • Companies want to use technology tactically to make their operations more effective and more efficient - Business intelligence can be the catalyst for that efficiency and effectiveness.
By definition, the moment any given business is operating, it begins generating data. Some obvious examples are sales, bookkeeping, production data, warehouse information, transportation and logistics, personnel, etc.In addition there also exists large volumes of data which are important to the business but not directly generated by business operations. Examples are market data, competitive data, tenders and proposal, legal information, raw material prices, etc.

As such, none of the above described information can be used in its raw form by corporate management to make decisions although the information is critical in helping make those business decisions.Therein lies the necessity for Business Intelligence. BI technologies help bring decision-makers the data in a form they can quickly digest and apply to their decision making. BI turns data into information for managers and executives and in general, people making decisions in a company.

     Benefits:

 The benefits of a well-planned BI implementation are going to be closely tied to the business objectives driving the project.
  1. Identify trends and anomalies in business operations more quickly, allowing for more accurate and timelier decisions.
  2. Deliver actionable insight and information to the right place with less effort .
  3. Identify and operate based on a single version of the truth, allowing all analysis to be completed on a core foundation with confidence.


Facebook Commentbox


Wednesday, 8 April 2015

What is metadata (Data about data)

Meta Data

The ETL metadata functional element is responsible for maintaining information (metadata) about the movement and transformation of data, and the operation of the data warehouse. It also documents the data mappings used during the transformations. Meta data logging provides possibilities for automated administration, trend prediction, and code reuse.
Metadata

Meta data examples:

Examples of data warehouse metadata that can be recorded and used to analyze the activity and performance of a data warehouse include:
o   Data Lineage, such as the time that a particular set of records was loaded into the data warehouse.
o   Schema Changes, such as changes to table definitions. 
o   Data Type Usage, such as identifying all tables that use the "Birthdate" user-defined data type. 
o   Transformation Statistics, such as the execution time of each stage of a transformation, the number of rows processed by the transformation, the last time the transformation was executed, and so on. 
o   DTS Package Versioning, which can be used to view, branch, or retrieve any historical version of a particular DTS package.
o   Data Warehouse Usage Statistics, such as query times for reports. 

Business Metadata:
In IT, Business Metadata is about creating definitions, business rules. The advantage is of this business metadata is whether they are technical or non-technical, everybody would understand what is going on within the organization. Example:
Metadata in ETL
Business Metadata
                     

Technical Metadata:
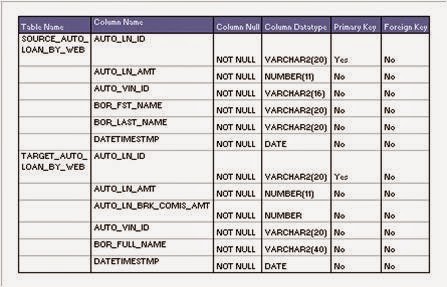
 Technical metadata describes information about technology such as the ownership of the database, physical characteristics of a database. In Technical metadata, derivation rules are important when formulae or calculations are applied on a column. Example:
Metadata IN ETL
Technical Metadata

Facebook Commentbox


Tuesday, 24 February 2015

Data Warehouse Design Approaches

Data Warehouse Design Approaches


There are two major types of approaches to building or designing the Data Warehouse.
  1.  The Top-Down Approach
  2.  The Bottom-Up Approach


s  The Top Down Approach:

  •       The data flow in the top down OLAP environment begins with data extraction from the operational data sources. This data is loaded into the staging area and validated and consolidated for ensuring a level of accuracy and then transferred to the Operational Data Store (ODS). 
  •      Detailed data is regularly extracted from the ODS and temporarily hosted in the staging area for aggregation, summarization and then extracted and loaded into the Data warehouse. 
  •      Once the Data warehouse aggregation and summarization processes are complete, the data mart refresh cycles will extract the data from the Data warehouse into the staging area and perform a new set of transformations on them. This will help organize the data in particular structures required by data marts. Then the data marts can be loaded with the data and the OLAP environment becomes available to the users

DWH TOP DOWN APPROACH
DWH TOP DOWN DESIGN APPROACH
  •     The data marts are treated as sub sets of the data warehouse. Each data mart is built for an individual department and is optimized for analysis needs of the particular department for which it is created.


 The Bottom-Up Approach:
          

  •      Ralph Kimball designed the data warehouse with the data marts connected  to it with a bus structure.
  •      The bus structure contained all the common elements that are used by data marts such as conformed dimensions, measures etc defined for the enterprise as a whole. 
  •        This architecture makes the data warehouse more of a virtual reality than a physical reality
  •       All data marts could be located in one server or could be located on different servers across the enterprise while the data warehouse would be a virtual entity being nothing more than a sum total of all the data marts
  •      In this context even the cubes constructed by using OLAP tools could be considered as data marts.

Kimball's  bottom-up Design Apporach
Kimball Approach

              The bottom-up approach reverses the positions of the Data warehouse  and the Data marts. Data marts are directly loaded with the data from the   operational systems through the staging area.

                   The data flow in the bottom up approach starts with extraction of data  from operational databases into the staging area where it is processed  and consolidated and then loaded into the ODS.

         The data in the ODS is appended to or replaced by the fresh data being loaded. After the ODS is refreshed the current data is once again extracted into the staging area and processed to fit into the Data mart  structure. The data from the Data Mart, then is extracted to the staging area aggregated, summarized and so on and loaded into the Data Warehouse and made available to the end user for analysis.


Facebook Commentbox


subscribe
Subscribe Us
emailSubscribe to our mailing list to get the updates to your email inbox... We can't wait more to have your email in our subscribers email list. Just put your nice email in below box: